


When I first started working with basic datasets—student scores, daily habits, and small research samples—I quickly learned that averages alone can be misleading. Two datasets could share the same mean and yet behave very differently. What helped reveal those hidden differences was standard deviation.
Standard deviation is one of the most important concepts in statistics because it explains how data behaves, not just where it centers. In this beginner-friendly guide, I’ll explain what standard deviation means, why it matters, and how to interpret it correctly using clear, real-world examples.
By the end, you’ll not only understand the definition, but also know when and how to use standard deviation responsibly.
What Is Standard Deviation?
Standard deviation measures how much the values in a dataset vary from the average (mean).
- A low standard deviation means most values are close to the mean
- A high standard deviation means values are spread out over a wider range
In practical terms, standard deviation answers a simple but powerful question:
How consistent is this data?
This definition aligns with standard statistical explanations found in introductory textbooks and educational platforms such as OpenStax and Khan Academy.
Why Standard Deviation Matters
In real-world data analysis—whether you’re reviewing exam results, tracking business performance, or evaluating research findings—variability matters just as much as the average.
Standard deviation is important because it:
- Adds context that the mean alone cannot provide
- Reveals consistency or instability in data
- Helps identify unusually high or low values (outliers)
- Supports better, data-driven decisions
For example, I’ve seen cases where two groups had identical averages, but one group’s results were highly unpredictable. Without standard deviation, that insight would have been completely missed.
Mean vs. Standard Deviation: What’s the Difference?
The Mean (Average)
The mean is calculated by adding all values and dividing by the number of observations.
Example:
Test scores: 70, 75, 80, 85, 90
Mean = (70 + 75 + 80 + 85 + 90) ÷ 5 = 80
The mean tells you where the center of the data lies—but nothing about how spread out the values are.
Standard Deviation
Standard deviation measures how far individual values typically fall from the mean.
Two classes may both have an average score of 80, but:
- One class may have most scores between 78 and 82
- Another may range from 50 to 100
Standard deviation reveals this difference clearly.
A Real-Life Example You Can Relate To
Imagine tracking daily step counts for two people over a week.
Person A (steps/day):
9,800 – 10,100 – 10,000 – 9,900 – 10,200 – 10,050 – 9,950
Person B (steps/day):
4,000 – 12,000 – 8,500 – 15,000 – 6,000 – 11,500 – 3,500
Both may have similar weekly averages, but their patterns are very different.
- Person A is highly consistent → low standard deviation
- Person B’s activity varies widely → high standard deviation
This is a common pattern I’ve seen in analyzing habit-tracking or performance data.
How Standard Deviation Is Calculated (Conceptually)
You don’t need advanced math to understand the logic behind standard deviation. Conceptually, the steps are:
- Calculate the mean
- Measure how far each value is from the mean
- Square those differences to remove negatives
- Find the average of the squared differences
- Take the square root to return to the original unit
Most software handles the calculation, but understanding this process helps you interpret results accurately.
Important expert note:
Standard deviation is sensitive to extreme values (outliers). A single unusually high or low value can significantly increase the result.
Population vs. Sample Standard Deviation
Population Standard Deviation
Used when your data includes every member of the group being studied.
Example:
The test scores of all students in a small class
Sample Standard Deviation
Used when data represents a subset of a larger population.
Example:
Surveying 100 people to estimate city-wide spending habits
In real-world analysis, sample standard deviation is far more common because complete population data is rarely available.
How to Interpret Standard Deviation Correctly
A standard deviation value only makes sense in context.
General interpretation guidelines:
- Small standard deviation → High consistency
- Large standard deviation → High variability
- Standard deviation near zero → Values are almost identical
For example, a standard deviation of 5 may be small for income data but extremely large for body temperature readings. Always consider what is being measured.
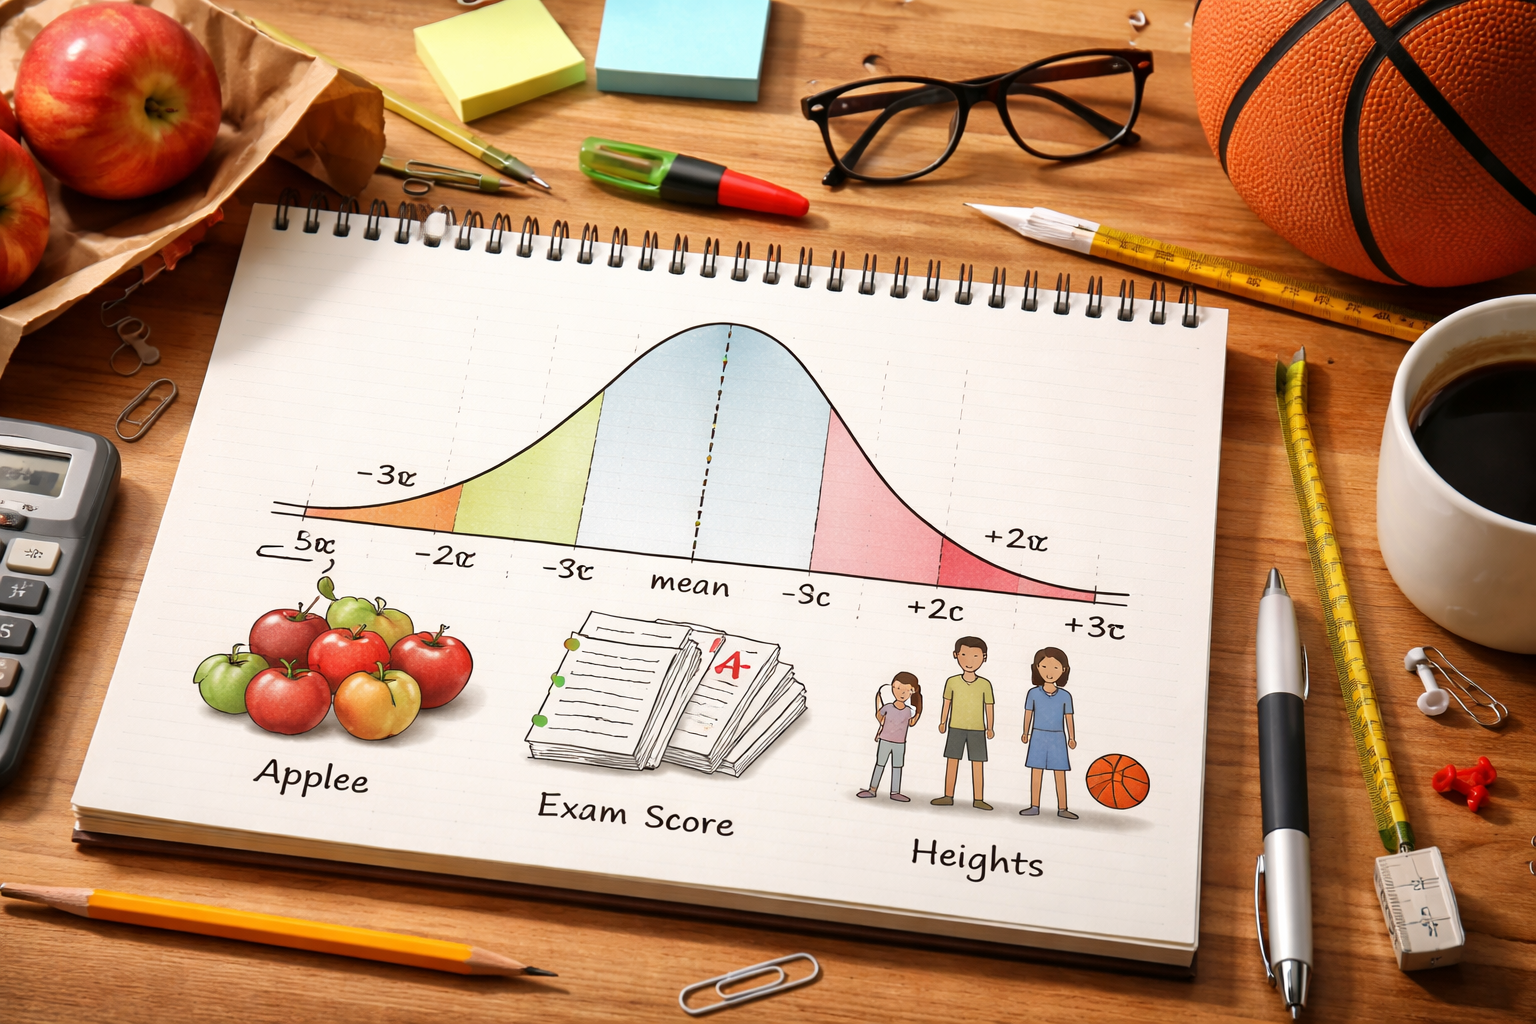
Standard Deviation and the Normal Distribution
Standard deviation is closely linked to the normal distribution (bell curve).
In a normal distribution:
- About 68% of values fall within 1 standard deviation of the mean
- About 95% fall within 2 standard deviations
- About 99.7% fall within 3 standard deviations
Expert clarification:
This rule applies only to data that follows a normal distribution, which is not always the case in real-world datasets such as income or social media metrics.
Common Uses of Standard Deviation
Education
- Evaluating consistency in test scores
- Comparing class or school performance
Finance
- Measuring investment risk and volatility
- Comparing asset stability
Business & Quality Control
- Monitoring product consistency
- Identifying process inefficiencies
Research & Science
- Analyzing experimental reliability
- Assessing measurement accuracy
Across these fields, standard deviation turns raw numbers into actionable insight.
Common Misunderstandings About Standard Deviation
“A High Standard Deviation Is Always Bad”
Not true. In creative performance or innovation metrics, variability may be expected or even desirable.
“Standard Deviation Explains Everything”
It does not. It works best alongside the mean, range, and other measures.
“Only Experts Can Use It”
While the formula looks complex, the concept is intuitive and useful for beginners.
When Standard Deviation May Not Be Enough
Standard deviation can be misleading when:
- Data is heavily skewed
- Extreme outliers dominate the dataset
- The distribution is not approximately normal
In such cases, additional measures like the median or interquartile range may be more informative.
Practical Tip: Using Standard Deviation Wisely
When reviewing data, I recommend asking:
- What does the average tell me?
- How much do values typically differ from it?
- Does the variability align with real-world expectations?
This habit helps prevent surface-level conclusions and improves decision-making.
Conclusion
Standard deviation is a foundational statistical tool that explains how data varies, not just where it centers. While the mean shows the middle, standard deviation reveals consistency, risk, and reliability.
For beginners, mastering standard deviation isn’t about memorizing formulas—it’s about understanding what the numbers are trying to tell you. Whether you’re analyzing test results, tracking habits, or exploring data out of curiosity, standard deviation gives you a clearer, more honest picture of reality.
Used correctly, it transforms numbers into meaningful insight.